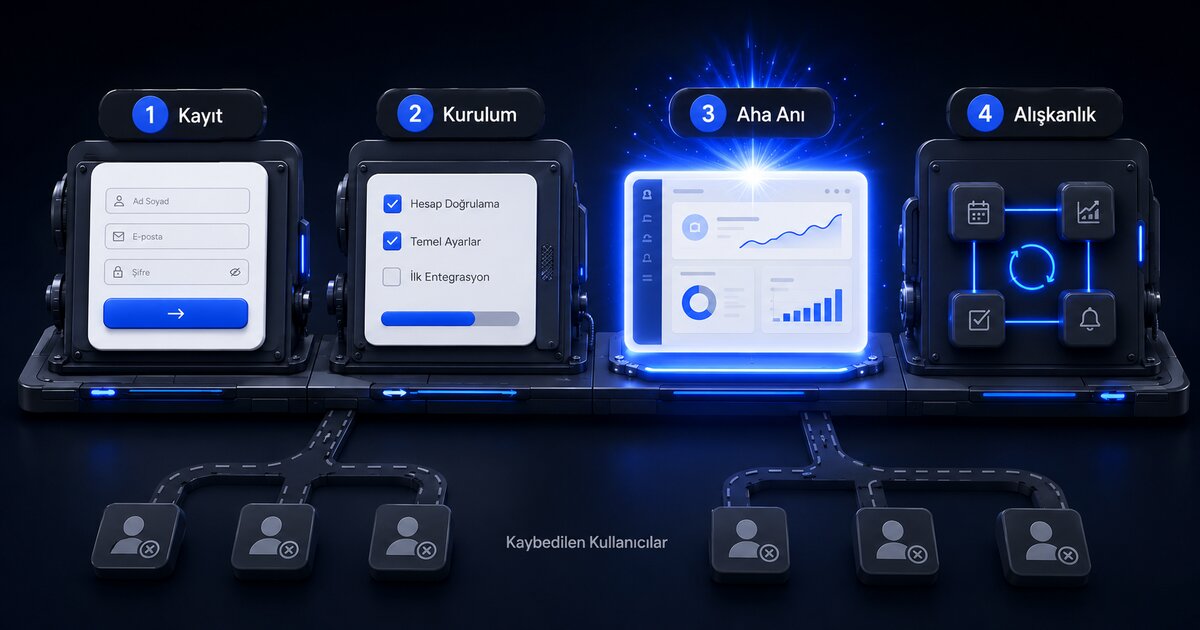
A user who fills in the signup form of a SaaS product has not been won yet. The winning moment is the first time they see the product’s promised value with their own eyes, and the bridge between signup and that moment is called onboarding. If the bridge is weak, even the best marketing budget drains away: users arrive, look around and quietly leave. In this post we examine onboarding through the current data and methods of 2026: how to define an activation metric, how to design the flow, what has changed, and where to start. As a studio operating three live SaaS products, we have added what we learned from our own experience at the end.
Why onboarding is the most critical surface of your product
The importance of onboarding is not a slogan; it is a measured fact. Amplitude’s 2025 product benchmark report, covering more than 2,600 companies, establishes a threshold summarized as the “7% rule”: if at least 7% of a signup cohort returns to the product on day seven, the product is in the top tier for activation performance. According to the same report, 69% of companies with strong day-seven activation are also among the top performers in three-month retention. In other words, a user lost in the first week does not miraculously come back in month three; the first sessions decide the product’s fate.
That is why onboarding should be treated not as marketing decoration or a final design touch, but as the most critical surface of the product. The good news: onboarding is the most measurable and most quickly improvable part of the SaaS funnel.
Define your activation metric first
Onboarding design does not start with the interface; it starts with a single question: in this product, what exactly has a user done when we can say they have seen the value?
Reforge’s widely adopted framework structures this question around three “moments”:
- Setup moment: What the user must complete to be in a position to experience value. Creating an account, connecting data, finishing the initial configuration.
- Aha moment: The first time the product’s core value proposition is experienced.
- Habit moment: The core action repeated within a defined window; the signal of lasting usage.
Reforge’s methodological advice reverses the order: define the habit moment first, then work backwards to derive the aha and setup moments.
The classic way to find the aha moment is to look for the correlation between behavioral data and long-term retention. Two textbook examples: Facebook’s “7 friends in 10 days” threshold and Slack’s “2,000 messages” threshold. In Slack’s data, 93% of teams that crossed that threshold stayed with the product. The lesson here is not the numbers themselves but the method: find the common early behavior of successful users in your own product, test the hypothesis with data, and declare it your official activation metric.
Once the metric is defined, the activation rate is simply the number of users reaching the threshold divided by the number of users completing signup.
2026 in numbers: where the industry stands
The most reliable current data sets paint this picture:
| Indicator | Value | Source |
|---|---|---|
| Average activation rate | 37.5% (54.8% in AI, as low as 5% in fintech) | Userpilot, 547 SaaS companies |
| Time-to-value (TTV) | Roughly 1.5 days on average | Userpilot, same data set |
| Median activation | 25-30% band; “good” = beating the 60th percentile of peers | Lenny’s Newsletter, 500+ products |
| Trial-to-paid conversion | Global median 18.5%; top quartile 35-45% | 1Capture 2025, 10,000+ companies |
| Activation-conversion link | Every 10-point activation increase lifts conversion by 6-10% | 1Capture 2025 |
The last row is the critical finding: activation is the leading indicator of conversion. The practical meaning of these numbers: instead of doubling your marketing budget to double signups, the far cheaper move is to stop losing more than half of the users already walking through the door.
What changed in onboarding for 2026
The linear product tour is dead, contextual guidance won
“Next, next, next” product tours had been criticized for years; now there is quantitative evidence against them. According to Chameleon’s 2025 benchmark data covering 550 million in-app interactions, 4-step tours see a 74% completion rate, collapsing to 16% at 7 or more steps. The trigger type is just as decisive: guidance triggered by the user’s own action reaches 67% completion, while tours that pop up on a timer stay at 31%. In the same data set, roughly half of all modal windows are dismissed without being read, while guidance embedded in the interface earns noticeably higher engagement.
The summary principle: do not explain everything up front. Show users what they need, where they are, and keep it short.
Personalization data is collected but not used
One of the most striking findings of 2025 is an inconsistency: 65% of products collect personalization data such as role and use case at signup, but only 18% actually change the flow with it. Asking users why they came and then showing everyone the same screen is an empty ritual that erodes trust.
The pattern that works is simple: a 2-4 question welcome survey and a first screen that visibly changes based on the answers. The right template surfaced, the first recommended action shaped by role. Adding more questions increases abandonment, not signal.
AI: from segmentation to real-time adaptation
The mature use of AI in onboarding is not generating a magical flow; it is showing you where users get stuck. The industry’s summary phrase: “AI will not fix your onboarding, it will show you what is broken.” That said, the tooling side is evolving fast: assistants that generate flows from natural language prompts, localize onboarding copy per market, and build campaigns from a described goal entered mainstream products across 2025-2026.
For AI products themselves, onboarding is different from the start: the first interaction is a conversation, not a form. The flow adapts to the user’s stated intent rather than their click path. A new trust rule was born here too: a product that makes automated decisions must explain its reasoning and leave the user a way to inspect and override. Automation that does not explain its decisions scares users instead of impressing them.
Onboarding no longer ends: everboarding
Current practice frames onboarding not as an event limited to the first session, but as a behavior-triggered education layer that runs across the entire lifecycle. Feature announcements, usage-pattern-based tips and short guidance appearing at the right moment are all part of this layer. The industry’s name for it is “everboarding”.
Self-serve and sales-assisted models are converging
The product-led versus sales-led dichotomy is giving way to a hybrid model: fully self-serve flows for small and mid-sized accounts, onboarding accompanied by a customer success team for enterprise and high-contract value accounts; both inside the same product. Userpilot’s benchmark data supports the choice: sales-assisted companies outperform self-serve ones on activation, checklist completion and time-to-value.
The building blocks of a good onboarding flow
The building blocks the frameworks converge on:
The straight line. The first half of ProductLed’s “bowling alley” framework: ruthlessly shorten the path from signup to the activation threshold. Three questions for every step: can it be deleted, can it be delayed, is it truly critical? This discipline can cut onboarding steps substantially and halve time-to-value.
The welcome survey. The 2-4 question survey described above, whose answers produce a visible result.
Empty states. A screen that says “no data yet” is not dead space; it is onboarding’s most valuable surface. Sample data, a ready-made template or a single clear call to action; ideally chosen based on the welcome survey answer.
A behavior-aware checklist. A 3-5 item list tied directly to the activation threshold. The critical detail: the list must auto-check any step the user has already completed through another path. Making users redo finished work kills their trust in the list.
Milestone emails. Sequences triggered by behavior, not by the calendar: 5-7 emails across the first two weeks, with users exiting the sequence the moment they reach the activation threshold. Sending the “day three tip” email to a user who crossed the threshold long ago is a declaration of indifference.
Progressive disclosure. A principle resting on decades of Nielsen Norman Group research: split complexity into layers and open at most two layers per interaction. Orientation first, contextual depth second, expert features last.
Measured gamification. Gamification did not die, but it matured. Progress bars and celebrations tied to real usage milestones work; generic badges and points with no connection to value erode trust.
Common mistakes
- ❌ The “big bang” tour that explains every feature in the first session
- ❌ Never using the personalization data collected at signup
- ❌ Segmenting users once and considering personalization done
- ❌ A static checklist that asks for steps already completed
- ❌ Dismissing empty screens with a “no data” message
- ❌ Opening modal windows back to back
- ❌ Limiting onboarding to the first session
- ❌ Praising features instead of describing the user’s outcome
- ❌ Triggering emails and notifications by calendar instead of behavior
- ❌ Applying AI decisions without explanation or override
What to measure
| Metric | What it tells you |
|---|---|
| Activation rate | Onboarding’s main output; users reaching the threshold / signups |
| Time-to-value (TTV) | Time between signup and activation; conversion rises as it shrinks |
| Flow completion rates | Per tour, checklist and survey; where the drop-off is |
| Feature adoption | Whether activated users are guided to the right features |
| Day 7 and day 30 retention | Leading indicators of activation quality |
| Trial-to-paid conversion | How onboarding quality shows up in revenue |
Instrument these metrics from day one; without a baseline you cannot know whether any improvement worked.
Implementation order: where to start
- Define the activation metric; everything depends on this decision.
- Map the path from signup to activation and shorten it ruthlessly.
- Set up measurement: activation, TTV, completion, adoption.
- Add the welcome survey and visibly reflect the answers on the first screen.
- Design the empty states of key screens.
- Build a behavior-aware 3-5 item checklist.
- Add contextual, action-triggered short guidance; cap tours at 3-4 steps.
- Connect the behavior-triggered email sequence.
- Separate self-serve and assisted onboarding by account value.
- Improve continuously: in Databox’s public case study, more than 20 small improvements over six months lifted activation from roughly 30% to over 40%. Onboarding is not a one-off redesign; it is a discipline of iteration.
What we learned from three products
At Codeck we operate imzala.org, Sekreter.co and Karekod.io in-house, and we have had the chance to test every item of the framework above on our own invoice. Three practical lessons:
The aha moment differs radically from product to product. At imzala.org the aha moment is the first document coming back signed by the counterparty; at Sekreter.co it is the assistant answering the first real phone call on the user’s behalf; at Karekod.io it is the first scan data arriving for a generated code. The common thread across all three: the aha moment is not the user’s own action but the first concrete result the product produces for them. We design onboarding as the shortest path to that result.
The most effective improvements were not interface work but step removal. No tour or tooltip we tried ever competed with the effect of completely removing a mandatory step from the path.
Onboarding is a product feature, not a marketing task. It should sit on the product roadmap from the first release and receive engineering resources. We described how this mindset relates to our studio model in our venture studio post.
If you are building your own SaaS product or preparing to take an MVP to market, we can design your activation metric and onboarding flow together; take a look at our SaaS MVP development approach or get in touch.
Sources
- Userpilot, User Activation Rate Benchmark Report: activation and TTV data from 547 SaaS companies
- Amplitude, The 7% Retention Rule: the 2025 benchmark report covering 2,600+ companies
- Chameleon, Mastering Product Tours: tour and checklist data from 550M interactions
- Chameleon, What Most Teams Get Wrong About Onboarding in 2025: current anti-pattern analysis
- Reforge, Define Customer Activation Moments: the setup / aha / habit framework
- ProductLed, User Onboarding Framework: the bowling alley framework
- June.so, Activation Playbook: the activation metric discovery method and classic cases
- Lenny’s Newsletter, What Is a Good Activation Rate?: the 500+ product activation survey
- 1Capture, Free Trial Conversion Benchmarks 2025: trial-to-paid conversion benchmarks